NATIONAL SWITCH STATISTICS
The Payment Systems Department runs two mission critical systems for the continued operation of business and consumers in PNG, with the support of other departments of the bank. The two systems are Kina Automated Transfer System (KATS) and the National Switch-Retail Electronic Payment System (REPS), which is operated by a dedicated group of employees who ensures their smooth operations. The inability of the payment systems, either KATS & REPS to process payments effectively and efficiently could disrupt nationwide economic activity.
In July 2024, another milestone was achieved when Tisa Bank Ltd and Credit Bank PNG were connected to the National Switch on 8th July & 15th July, respectively. This brought a new total of eight (8) financial institutions being connected to the National Switch.
What does REPS Process?
REPS processes card-based transactions using ATMs and EFTPOS terminals. The eight members of REPS include commercial banks, Micro Banks, Savings and Loan licensed financial institutions. They are BSP Financial Group Limited (BSP), Westpac Bank (PNG) Limited, Kina Securities Limited (Kina Bank), CreditBank PNG, TISA Bank Limited, NASFUND Contributors Savings & Loans Limited (NCSL), Nationwide Microbank Limited (MiBank), and National Banking Corporation Limited (NBC).
Any ATM or EFTPOS terminal offered by a REPS Member is open to the local debit cards offered by any other Member. This means a card issued by any of these Members can be used at other REPS Member devices making in-store payments easy and access to cash available at virtually all ATMs and EFTPOS counters in PNG.
With Kina Bank decommissioning the use of its local debit cards on the 31st October 2024 and issuing Visa Debit Cards, REPS will not be capturing the Kina Bank Visa Debit Cards transactions.
REPS also processes Instant Payment Transactions (IPT). IPT was launched in March 2021. These are a real time digital payment currently offered by the non-bank REPS members – NCSL, MiBank and NBC. IPT volumes remain low as expected until the commercial banks offer them. Refer to Table 1. Commercial banks and Mobile Network Operators (MNO’s) will be added after the review of National Payments Strategy 2024-2026 is completed and implemented in 2025.
REPS is a 24/7 system. It operates 24 hours a day, 7 days a week – every day of the year. If people need to make a card-based payment on the weekend or after business hours REPS processes the transaction. An important transaction offered by REPS (and local debit cards) is the EFTPOS Purchase + Cashback. This allows people to make a card payment at a shop and get cash at the same time.
When did REPS Go-Live?
The Retail Electronic Payments System (REPS), with the National Switch at its core, commenced operation in 21 July 2019, with three inaugural members, namely BSP, Kina Bank and NCSL and three more institutions joined on 1st of September. They were Westpac Bank, NBC and MiBank. Another important development during the period was the acquisition of ANZ Bank Retail Customers by Kina Bank on the 23rd September, which resulted to significant increase in volumes processed by the National Switch.
After the launch in July 2019, REPS continued to deliver improved access with minimal disruptions and processed over 95.7 million transactions (excluding balance enquiries), valued at K16.7 billion at the end of June 2025.
Two new REPS members joined in July 2024. They are TISA Bank on the 8th of July and Credit Bank on the 15th of July 2024. This brings the total of eight (8) financial institutions connected to National Switch.
The Disputes portal for the REPS card switching system was implemented on the 26th November 2024. Pilot testing was done with BSP and Kina Bank with the portal commissioned for use by the pilot members on the 12th December 2024. All other REPS participants were on-boarded to disputes portal in first Quarter of 2025.
Ongoing Developments
In May 2024, the draft National Payments Strategy (NPS) 2024-2026 was released to the National Payments Council for review and feedback. Following the review, the strategy was updated and was presented to the Board of BPNG in September 2024. The Board advised to provide more detail on collaborating efforts with all stakeholders in BPNG, pricing models and clear plans for outsourcing REPS in the future. It is under quality assurance and presented to the Board in third quarter of 2025.
The scope for the REPS Phase-2 was agreed upon, with a focus on four (4) key areas over the next 12 months –
- An assessment of the payment system operated in PNG against the internationally recognized Principles for Financial Market Infrastructures (PFMI) standard.
- Development of a Business Case to determine whether BPNG should invest additional funds to make the card switch PCI/DSS compliant so that it is able to process EMV (scheme) cards. This is being driven by the industry moving away from mag-stripe cards, which are susceptible to fraud, towards EMV chipped cards which are safer but do incur additional fees.
- Implementing the lessons learned from the pilot of the Instant Payments Transaction (IPT) and addressing the shortfalls before moving the system into full production later in the year. The focus of this activity is to provide an Instant Payments platform that supports digital and mobile payments, and allows for a wider range of payment services to support the objective of financial inclusion.
- Development of a Business Case to determine the viability of offering a white label service for the onshore production and settlement of chipped cards on behalf of all card issuers in PNG.
In spite of the above developments, the Bank of PNG Board met on 12 September 2024 and reviewed the National Payments Strategy.
The Board noted that financial inclusion was integral to the Strategy and required more focus, in particular how the instant payments gateway would increase financial inclusion. Financial inclusion should be the overarching objective of the Strategy, and that more consideration needed to be given as to how the Strategy would drive the agenda, through the steps proposed.
The Board asked for more information about the profitability or otherwise of the existing payments systems or channels including REPS and KATS that could be used as a baseline for future development including a strong business case for the provision of subsidized services and how it would impact financial inclusion. The Board asked to strengthen the summary of the strategy and work-plan for 2025-2026, including a developed business case for costings, staging and timeframes for 2025. They asked for further consultation, particularly regarding the ICT requirements.
A working group was formed to review the Strategy and develop the additional information for the Board, and in particular the business cases.
A revised strategy drafted with recommendations for quality assurance by a third party is being prepared for the consideration of BPNG Board.
Statistics from all Participating Institutions[1]
(BSP, Kina, NCSL, WPC, MiBank & NBC)
Total Values and Volumes Processed by National Switch
Table 1. REPS Summary Statistics
| Total Transaction Volumes | IPT Values | |||
| Period | Domestic Debit Cards | Instant Payment Transactions (IPT) | Total (PGK) | Average Transaction Value (PGK) |
| 2019[1] | 4,336,050 | N/A | N/A | N/A |
| 2020 | 13,825,844 | N/A | N/A | N/A |
| 2021[2] | 18,118,532 | 211 | 84,751 | 402 |
| 2022 | 25,937,214 | 779 | 358,373 | 460 |
| 2023 | 28,611,453 | 570 | 208,836 | 366 |
| 2024 | 29,100,622 | 607 | 251,576 | 414 |
| 2025[3] | 10,436,016 | 0[4] | 0 | N/A |
| January | 1,529,764 | 0 | 0 | N/A |
| February | 1,430,561 | 0 | 0 | N/A |
| March | 1,466,427 | 0 | 0 | N/A |
| April | 1,462,764 | 0 | 0 | N/A |
| May | 1,541,850 | 0 | 0 | N/A |
| June | 1,515,676 | 0 | 0 | N/A |
| July | 1,488,974 | 0 | 0 | N/A |
[1] On 21st July 2019, National Switch went live with BSP, Kina Bank and NCSL. The other three (3) new members, namely Westpac, NBC and MiBank were connected on 01st September 2019.
[2] On 28th March 2021, Instant Payments Transactions (IPT’s) went live.
[3] The 2025 figures are up to end of July.
[4] There are no IPT transactions since September 2024 due to NCSL and NBC making a decision to disconnect from REPS IPT services pending the review NPS and a IPT solution by BPNG.
Table 2. Debit Card Statistics
|
VOLUMES | VALUES | ||||||||||||
| ATM | POS | Chargeable Industry Volumes [1] | Chargeable Cumulative Industry Volumes | Total Vol | Cumulative Total Volumes | Industry Values (PGK'm) | Cumulative Industry Values (PGK'm) | |||||||
| Withdwl |
Bal Enq (Not Charged) |
Cumulative BI | Purch & Cash Adv + C/Back | Purchase |
Bal Enq (Not Charged) |
|||||||||
| 2019[5] | 852,156 | 511,939 | 511,939 | 1,162,399 | 1,809,554 | 3,824,111 | 3,824,111 | 4,336,050 | 4,336,050 | 693.60 | 693.60 | |||
| 2020 | 2,648,001 | 1,572,413 | 2,084,352 | 3,874,371 | 5,731,059 | 12,253,431 | 16,077,542 | 13,825,844 | 18,161,894 | 2,192.75 | 2,886.35 | |||
| 2021 | 2,968,050 | 3,806,257 | 5,890,609 | 4,729,975 | 6,614,250 | 14,312,275 | 30,389,817 | 18,118,532 | 36,280,426 | 2,539.45 | 5,425.79 | |||
| 2022[6] | 3,490,260 | 1,604,040 | 7,494,649 | 6,338,566 | 8,639,381 | 5,864,967 | 18,468,207 | 48,858,024 | 25,937,214 | 62,217,640 | 3,300.05 | 8,725.79 | ||
| 2023 | 3,218,970 | 1,418,418 | 8,913,067 | 6,710,903 | 9,566,107 | 7,697,055 | 19,495,980 | 68,354,004 | 28,611,453 | 90,829,093 | 3,419.61 | 12,122.08 | ||
| 2024[7] | 2,873,416 | 1,307,172 | 10,220,239 | 7,324,015 | 9,561,029 | 8,034,680 | 19,758,770 | 88,112,774 | 29,100,622 | 119,929,715 | 3,301.73 | 15,413.26 | ||
| 2025 | 1,441,224 | 661,386 | 10,881,625 | 3,170,046 | 4,246,264 | 936,253 | 8,847,838 | 96,960,612 | 10,436,016 | 130,356,035 | 1,499.77 | 16,923.58 | ||
| Jan | 213,549 | 100,892 | 10,321,131 | 473,068 | 605,485 | 136,770 | 1,292,102 | 89,404,876 | 1,529,764 | 121,459,479 | 230.09 | 15,653.90 | ||
| Feb | 198,020 | 88,245 | 10,409,376 | 448,936 | 575,225 | 139,292 | 1,222,181 | 90,627,057 | 1,430,561 | 122,909,197 | 209.81 | 15,863.71 | ||
| Mar | 194,113 | 85,902 | 10,495,278 | 464,366 | 603,822 | 118,224 | 1,262,301 | 91,889,358 | 1,466,427 | 124,356,467 | 203.90 | 16,067.60 | ||
| Apr | 200,024 | 91,940 | 10,587,218 | 448,788 | 595,874 | 126,138 | 1,244,686 | 93,134,044 | 1,462,764 | 125,819,231 | 211.29 | 16,278.89 | ||
| May | 213,640 | 97,769 | 10,684,987 | 466,030 | 638,374 | 126,037 | 1,318,044 | 94,452,088 | 1,541,850 | 127,361,081 | 221.43 | 16,500.32 | ||
| June | 214,832 | 100,902 | 10,785,889 | 434,334 | 612,970 | 152,638 | 1,252,440 | 95,704,528 | 1,515,676 | 128,867,061 | 210.71 | 16,711.04 | ||
| July[8] | 207,046 | 95,736 | 10,881,625 | 434,524 | 614,514 | 137,154 | 1,256,084 | 96,960,612 | 1,488,974 | 130,356,035 | 212.54 | 16,923.58 | ||
[5] On 21st July, National Switch Went-Live with BSP, Kina Bank and NCSL. On the 01st of September 2019, three additional institutions, Westpac, NBC & MiBank joined the National Switch and following on 22nd September Kina Bank acquired the Retail business from ANZ Bank. This resulted to substantial increase in the volumes of transactions switched via the National Switch.
[6] Beginning year 2022 - POS BI was part of ATM BI calculations effective 29 Mar 21 to 31 Dec 21. It was then captured as separate item column effective 01Jan22 under POS BI. The statistics also reveals that most cardholders use POS to check their balances instead of ATM’s.
[7] Tisa Bank & Credit Bank were connected to the National Switch on 8th July & 15th July, respectively.
[8] July 2025 – the National Switch processed over K16.9b. The volumes processed during the same period was over 96.9 million (chargeable) & 33.4 million (non-chargeable) transactions.
Chart 1. REPS Charts from all participating Institutions
This chart indicates the monthly volumes by type of cards used for payment and aggregate values in K’ millions.
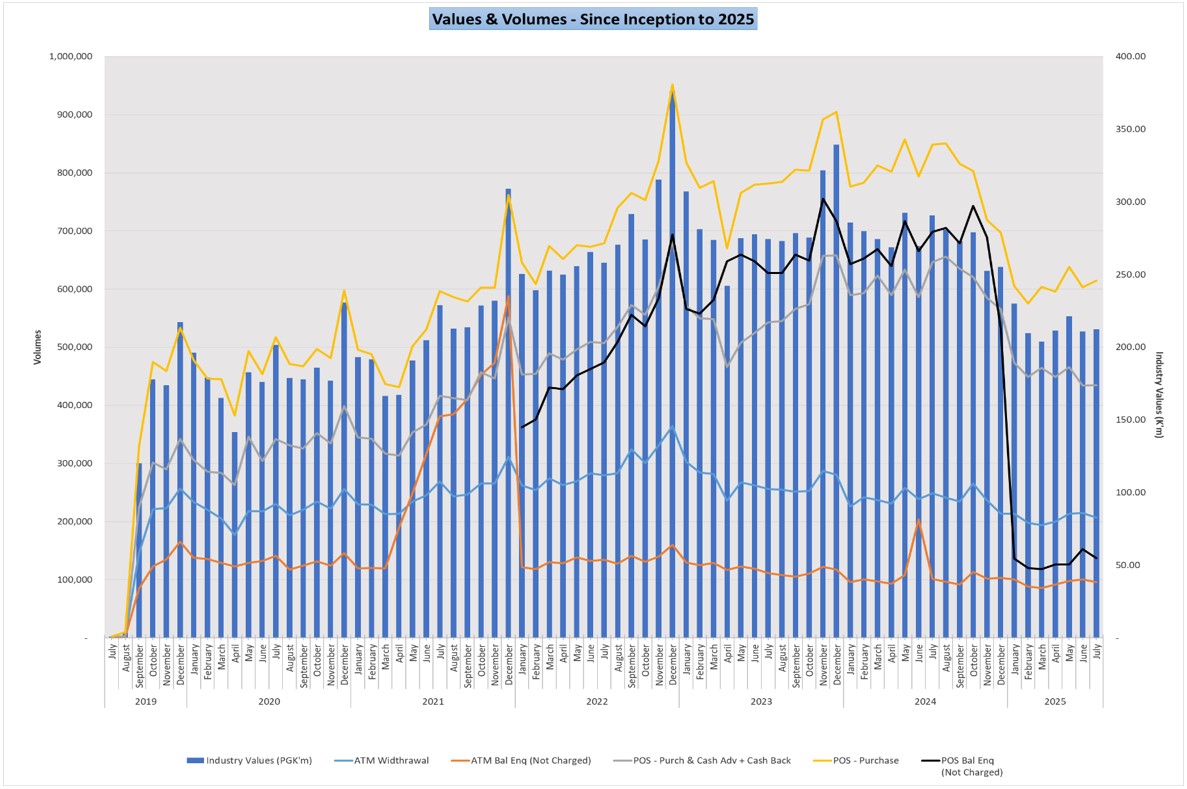
NB: Monthly industry values (K’ millions) shown in this chart, when added together month by month since go-live in July 2019, will equate to the cumulative values (K’ millions) shown in the statistics table on the previous page.
In April 2021 REPS introduced the Point of Sale- Balance Inquiry (POI-BI) transaction. The figures above for ATM Bal Inquiry include the POS BI volumes from April 2021 onwards. As this transaction has no fees it has been popular with end-customers and its impact can be seen from May onwards.
Volumes were particularly high in the December festive season and have returned to normal trend in January. Note as well that POS BI was effectively separated from ATM Bal Inquiry and captured as a separate line item effective Jan-2022.
Note: The black trend-line on the graph shows POS Balance enquiry (Not chargeable) segregated and reported separately beginning in January 2022 – Refer to Table-2. April 2023 indicates a spike in the POS BI transactions due to upgrade of BSP’s Core Banking Services early April that affected BSP customer’s mobile banking and Internet banking services.
The graph shows a steep decline in POS Balance enquiry volumes (Not chargeable) toward the end of 2024 with BSP ceasing POS Balance enquiry using its POS devices.
With Kina Bank decommissioning the use of its local debit cards (magstripe) in October 2024 and issuing Visa Debit Cards, showing a decline in POS Purchase with Cash Back transactions and POS Purchase transactions volumes. Also, shows a gradual decline in industry values.
MiBank Transactions with Kina Bank
In August 2020 Kina Bank and MiBank commenced a business arrangement relating to card transactions for the MiBank customers to be routed via Kina Bank. The arrangement means:
- REPS sends all MiBank card transactions to Kina Bank, who in turn sends them to MiBank;
- When MiBank customers use Kina Bank terminals they are routed directly to MiBank and they are not sent to REPS.
As a part of this arrangement MiBank, as the card Issuer, has agreed to have the transactions performed on Kina Bank terminals charged by BPNG in the same way as if they were processed using REPS.
These transaction volumes are reported to BPNG every day. Table 3 contains these statistics. These transactions are in addition to the volumes shown in Tables 1 & 2.
Table 3. Statistics from MiBank & Kina Bank
Total Values and Volumes Processed by National Switch
|
VOLUMES | VALUES | ||||||||||
| ATM Withdrawal | ATM Bal Enq (Not Charged) |
Cumul ative BI |
POS - Purch & Cash Adv + Cash Back | POS Purchase | Chargeable Industry Volumes [1] | Chargeable Cumulative Industry Volumes | Total Volumes | Cumulative Total Volumes |
Industry Values (PGK'm) |
Cumulative Industry Values (PGK'm) | ||
| 2020 | 10,925 | 4,862 | 12,732 | 5,514 | 6,541 | 22,980 | 22,980 | 27,842 | 27,842 | 13.63 | 13.63 | |
| 2021 | 47,054 | 18,422 | 23,284 | 29,960 | 34,833 | 111,847 | 134,827 | 130,269 | 158,111 | 52.82 | 66.45 | |
| 2022 | 98,470 | 40,004 | 63,288 | 73,698 | 82,326 | 254,494 | 389,321 | 294,498 | 452,609 | 112.25 | 178.66 | |
| 2023 | 130,043 | 52,066 | 115,354 | 107,843 | 145,229 | 343,348 | 732,669 | 435,181 | 887,790 | 137.61 | 324.75 | |
| 2024 | 146,245 | 52,369 | 167,723 | 161,308 | 192,051 | 499,604 | 1,272,040 | 551,973 | 1,439,763 | 159.46 | 482.63 | |
| 2025[9] | 94,395 | 30,619 | 198,342 | 89,630 | 110,471 | 6,606,599 | 7,878,639 | 325,115 | 1,764,878 | 94.66 | 577.29 | |
| Jan | 12,146 | 4,352 | 172,075 | 12,774 | 15,135 | 40,055 | 1,312,095 | 44,407 | 1,484,170 | 14.21 | 496.84 | |
| Feb | 11,904 | 3,708 | 175,783 | 12,004 | 14,470 | 38,378 | 1,350,473 | 42,086 | 1,526,256 | 12.87 | 509.71 | |
| Mar | 13,431 | 4,399 | 180,182 | 13,736 | 16,175 | 319,073 | 1,669,546 | 47,741 | 1,573,997 | 12.91 | 522.61 | |
| Apr | 13,217 | 4,333 | 184,515 | 13,048 | 16,011 | 794,614 | 2,464,160 | 46,609 | 1,620,606 | 13.15 | 535.77 | |
| May | 14,196 | 4,842 | 189,357 | 13,666 | 16,517 | 810,684 | 3,274,844 | 49,221 | 1,669,827 | 13.77 | 549.54 | |
| June | 14,332 | 4,201 | 193,558 | 11,826 | 15,817 | 1,766,621 | 5,555,494 | 46,176 | 1,716,003 | 13.35 | 562.89 | |
| July | 15,169 | 4,784 | 198,342 | 12,576 | 16,346 | 2,323,145 | 7,878,639 | 48,875 | 1,764,878 | 14.40 | 577.29 | |
[9] The 2025 statistics only shows the accumulated totals to end of July 2025.
Chart 2. REPS Charts on transaction between MiBank and Kina Bank.
This chart indicates the monthly volumes by type of cards used for payment and aggregate values in K’ millions for MiBank & KINA.
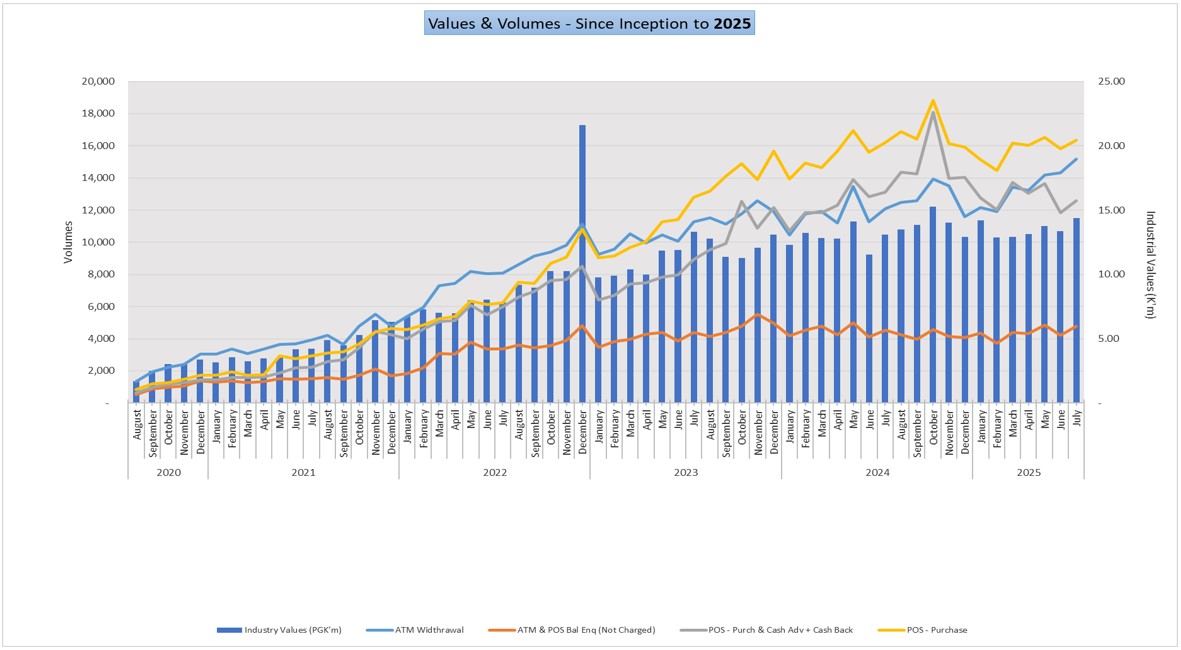
NB: December 2022 monthly industry values (K’ millions) shown on chart 2 reflects an increase in value due to festive spending by MiBank customers. In 2025, industry values returned to normal pattern. Transaction volumes for May are higher than April.
Payment Systems Department
18th August 2025