1. Preface
Safe, stable and efficient payment systems are critical to the effective functioning of the financial system. Payment systems are how funds are transferred, primarily among banks. It is the main channel through which financial shocks are transmitted across domestic and international financial systems and markets. Therefore, a robust payment system is the key infrastructure required to maintain and promote financial stability.
The payments system is the collective term for all the individual payment systems in a country and has a strong influence on the velocity of financial flows in the economy, the overall costs, and liquidity. It is also a channel for monetary policy transmission. The Bank of Papua New Guinea is committed to ensuring that it is safe and functioning efficiently. The Central Banking Act 2000 states that one of the primary objectives of the Bank is to “promote an efficient national and international payments system." This is strengthened further by the National Payments System (NPS) Act 2013, which provides the legal foundation to implement new payment types, such as electronic cheque truncation, which came into operation in September 2014, and direct credits in 2015.
The Bank of Papua New Guinea introduced the Kina Automated Transfer System (KATS) over the last three years with the objective of fostering an efficient payment system for processing and settling all payments (both small and large value) between all the banks and their customers. This included electronic payments, which are safe, efficient, fast, and predictable. The operation and usage of KATS are defined in the KATS System Rules. All the banks (including BPNG in its dual role as a bank and as the operator of KATS) agree to abide by the System Rules.
2. Types of Payment Instruments in KATS
There are three (3) types of payment instruments currently handled by KATS.
- Real-Time Gross Settlement (RTGS). These are mainly high-value and high-priority interbank or individual payment instructions that must be settled by debiting and crediting the accounts of the banks involved immediately (in real-time) and individually (gross) with finality and irrevocability (i.e., they cannot be disputed or reversed). It is a requirement of the KATS System Rules that every RTGS payment in favour of a customer of a bank must be credited to that customer’s account at the receiving bank within no more than two (2) hours of being settled in KATS.
RTGS went live on 14th October 2013.
- Electronic Cheque Exchange (Cheque Truncation). This is a process whereby cheques are scanned at the bank where they are deposited, and the images of the scanned cheques, together with the accompanying details, are exchanged between the banks electronically, via KATS. Currently, banks have a four-day period during which they can dishonour cheques. This period will be progressively reduced over the next one to two years as banks become more comfortable with KATS and the way it operates.
Cheque Truncation went live on 8th September 2014
- Direct Credits (DC’s). This is the process whereby an individual or company can request their bank to make a payment to the account of another individual or company at any bank. Direct Credits are settled twice daily within KATS. Depending on the time of day when a Direct Credit payment is processed by KATS, the funds are available to the recipient’s account on the same or the next day, if all account details are correct.
Direct Credits went live on 9th February 2015
3. Payment Systems Unit
Within BPNG, the Payment Systems Unit (PSU) is the operator of KATS and is responsible for opening and closing the KATS business day, monitoring the banks’ reserve funds, monitoring transactions between banks during the KATS operating hours, funding the Exchange Settlement Account (ESA) requirements, and responding to queries from all the commercial banks.
PSU is also responsible for producing payment statistics processed in KATS.
4. Inter-bank Transactions
In PNG, there is one single system that processes interbank transactions, which is operated and overseen by the Bank of PNG. It is a so-called hybrid system, which accepts both “low value” (cheques & DCs) and “high value/priority” (RTGS) payments.
Due to the different stages of KATS implementation, PSU began to compile statistics in January 2015.
Statistics from Jan-2015 to September-2025
TABLE 1: VALUES BY TYPES OF PAYMENTS
| Year | RTGS (K’ Million) | Cheques ( K’ Million) | Direct Credits (K’ Million) |
| 2015 | 31,598 | 43,426 | 13,181 |
| 2016 | 52,027 | 34,319 | 16,846 |
| 2017 | 42,972 | 28,356 | 18,740 |
| 2018 | 84,360 | 26,242 | 26,683 |
| 2019 | 98,102 | 23,460 | 31,052 |
| 2020 | 65,248 | 19,135 | 32,121 |
| 2021 | 64,324 | 17,577 | 36,679 |
| 2022 | 113,989 | 22,955 | 45,671 |
| 2023 | 195,285 | 18,226 | 54,009 |
| 2024 | 502,641 | 7,478 | 67,774 |
| 2025[1] | 319,750 | 4,079 | 55,707 |
| 2024 | |||
| Jan | 23,131 | 1,191 | 4,938 |
| Feb | 24,657 | 791 | 4,996 |
| Mar | 31,270 | 665 | 5,696 |
| QTR 1 | 79,058 | 2,647 | 15,630 |
| Apr | 23,380 | 919 | 5,228 |
| May | 35,750 | 869 | 5,792 |
| Jun | 35,540 | 619 | 5,174 |
| QTR 2 | 94,670 | 2,407 | 16,194 |
| Jul | 51,187 | 368 | 6,374 |
| Aug | 51,443 | 421 | 5,536 |
| Sep | 43,146 | 345 | 5,663 |
| QTR 3 | 145,776 | 1,134 | 17,573 |
| Oct | 45,303 | 294 | 6,280 |
| Nov | 40,157 | 484 | 5,954 |
| Dec | 97,677 | 512 | 6,143 |
| QTR 4 | 183,137 | 1,290 | 18,377 |
| TOTAL | 502,641 | 7,478 | 67,774 |
| 2025 | |||
| Jan | 33,915 | 517 | 5,733 |
| Feb | 28,889 | 348 | 5,423 |
| Mar | 28,695 | 441 | 5,956 |
| QTR 1 | 91,499 | 1,306 | 17,112 |
| Apr | 39,281 | 407 | 6,436 |
| May | 38,062 | 333 | 6,152 |
| June | 29,450 | 369 | 6,175 |
| QTR 2 | 106,793 | 1,109 | 18,763 |
| July | 44,051 | 445 | 7,346 |
| August | 37,729 | 686 | 6,084 |
| Sept | 39,678 | 533 | 6,402 |
| QTR 3 | 121,458 | 1,664 | 19,832 |
| TOTAL | 319,750 | 4,079 | 55,707 |
[1] Data for 2025, only reports up to the month of September 2025
TABLE 2: VOLUMES BY TYPES OF PAYMENTS
| Year | RTGS | Cheques | Direct Credits |
| 2015 | 65,005 | 1,667,137 | 2,066,657 |
| 2016 | 70,372 | 1,419,753 | 2,419,273 |
| 2017 | 80,067 | 1,222,793 | 2,663,180 |
| 2018 | 96,857 | 1,073,319 | 3,062,576 |
| 2019 | 108,887 | 959,876 | 3,508,368 |
| 2020 | 105,488 | 705,048 | 3,958,155 |
| 2021 | 129,783 | 586,675 | 4,318,630 |
| 2022 | 185,602 | 553,485 | 4,927,565 |
| 2023 | 301,176 | 441,650 | 5,739,414 |
| 2024 | 478,455 | 146,500 | 7,068,873 |
| 2025[2] | 459,507 | 79,332 | 5,725,580 |
| 2024 | |||
| Jan | 31,962 | 14,077 | 511,304 |
| Feb | 32,802 | 11,337 | 528,554 |
| Mar | 32,922 | 12,227 | 537,634 |
| QTR 1 | 97,686 | 37,641 | 1,577,492 |
| Apr | 36,230 | 14,019 | 554,607 |
| May | 40,827 | 14,664 | 612,911 |
| Jun | 35,222 | 12,671 | 525,634 |
| QTR 2 | 112,279 | 41,354 | 1,693,152 |
| Jul | 43,301 | 9,450 | 618,936 |
| Aug | 46,385 | 9,525 | 622,524 |
| Sep | 41,906 | 8,766 | 597,098 |
| QTR 3 | 131,592 | 27,741 | 1,838,558 |
| Oct | 46,478 | 9,994 | 698,538 |
| Nov | 44,430 | 12,331 | 624,787 |
| Dec | 45,990 | 17,439 | 636,346 |
| QTR 4 | 136,898 | 39,764 | 1,959,671 |
| TOTAL | 478,455 | 146,500 | 7,068,873 |
| 2025 | |||
| Jan | 48,178 | 16,841 | 598,910 |
| Feb | 46,094 | 3,769 | 577,677 |
| March | 49,009 | 5,249 | 611,654 |
| QTR 1 | 143,281 | 25,859 | 1,788,241 |
| Apr | 49,686 | 6,957 | 641,314 |
| May | 53,062 | 9,417 | 667,779 |
| June | 51,514 | 8,744 | 624,262 |
| QTR 2 | 154,262 | 25,118 | 1,933,355 |
| July | 57,720 | 9,768 | 701,902 |
| August | 52,033 | 9,874 | 650,734 |
| Sept | 51,674 | 8,713 | 651,348 |
| QTR 3 | 161,427 | 28,355 | 2,003,984 |
| TOTAL | 458,970 | 79,332 | 5,725,580 |
[2] Data for 2025, only reports up to the month of September 2025
Chart. 1: Values & Volumes by Real Time Gross Settlement (RTGS) Payments
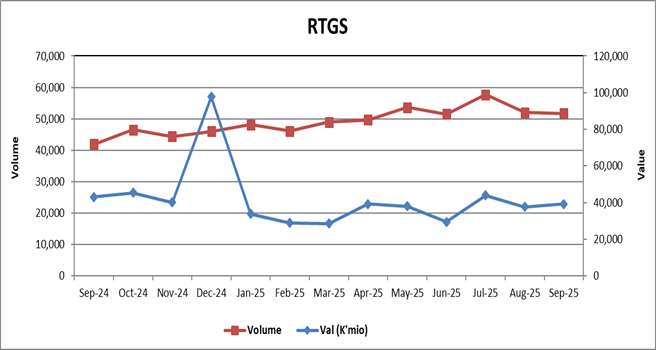
Note: In September, RTGS transaction volume declined by 0.7 percent and value increased by 4 percent respectively. Reduction in volume is due to fewer high-value transactions being processed, whilst the values increased due to higher corporate taxes, treasury bill purchases, central bank bills, intraday liquidity facilities, and repurchase agreements with commercial banks.
Chart. 2: Values & Volumes by Cheques Payments
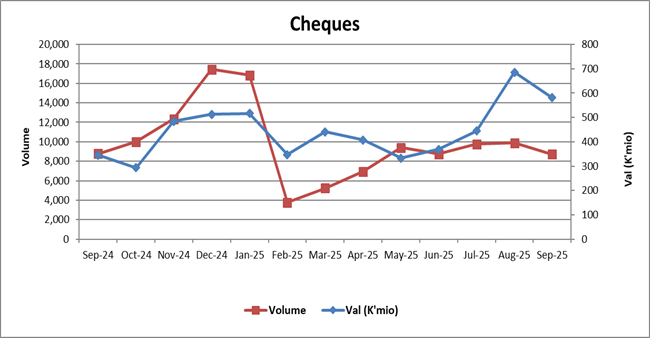
Note: The Cheques transaction volume and values decreased by 12 percent and 27 percent respectively in the month of September. The decline in values and volumes of cheques was largely driven by phase out of private sector cheques. Notably, since June 2024, only cheques issued by the government and State-Owned Enterprises (SOEs) have remained eligible for payment processing.
Chart. 3: Values & Volumes by Direct Credit (DC) Payments
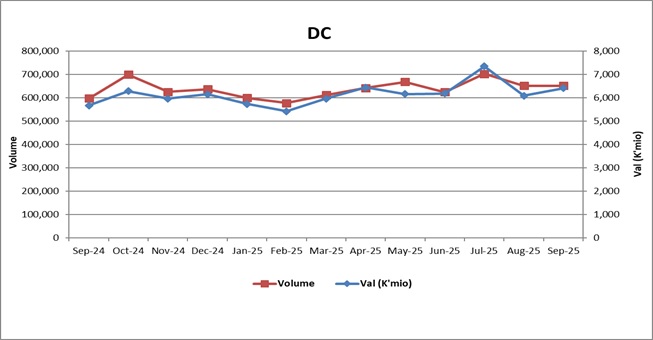
Note: In September, Direct Credit transaction volume and value increased by 0.1 percent and 5.2 percent, respectively. This growth in electronic payment activity was largely influenced by the decrease in the use of private sector Cheques, which led to a general increase in transaction flows across the system. Refer to Footnote in Chart 4 for more details.
Chart. 4: Trends in RTGS, CHQS & DC Volumes since the launch of DC payments
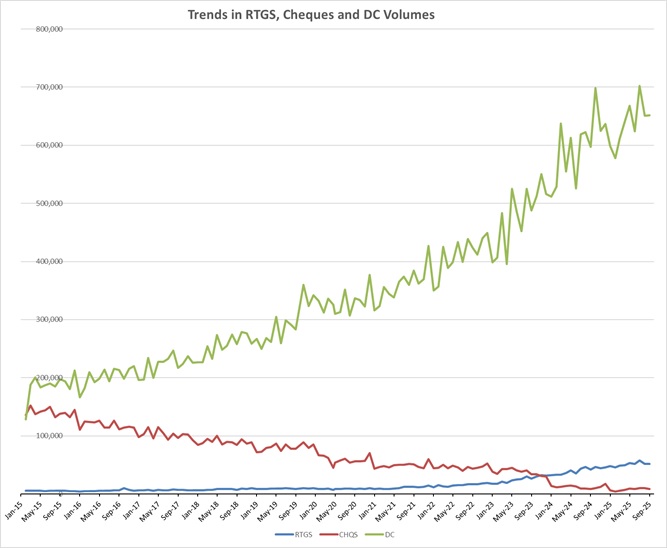
In September 2025, cheque volumes and values dropped by 12 percent and 27 percent respectively. Overall cheque usage has steadily declined since the introduction of KATS in 2015. The phase-out of private sector cheques on June 28, 2024, has further contributed to this trend, leaving only government and state-owned enterprise cheques in circulation.
Cheque usage is expected to decrease further as electronic payment platforms continues to grow as evident in the Direct Credits upward trend. This shift is also gaining momentum with REPS, where broader transition toward digital payments is being adopted.
Chart. 5: Cheques as a Proportion of Interbank Retail Payments
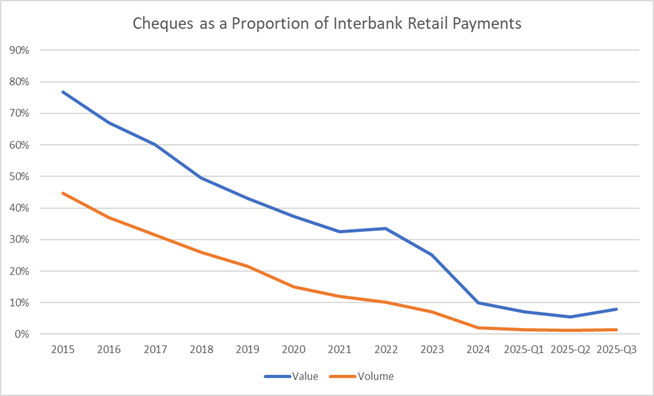
Chart 5 shows two trends that is the volume and value of Cheques as a percentage of total retail payments since 2015. It shows that both are declining. Cheques are being replaced by electronic means of payment, as expected.
Date Updated 07th October 2025
Source:
Payment Systems Department
Bank of Papua New Guinea